World of Warcraft as an Economic Laboratory: What a Ban Wave Taught Us About Supply and Demand
In 2007, epidemiologists published a paper in The Lancet Infectious Diseases about a World of Warcraft bug. A disease called Corrupted Blood had accidentally spread through the game’s population in ways that mirrored real-world pandemics, including super-spreading, quarantine evasion, and non-compliance. The researchers argued that virtual worlds were underused as models for studying human behavior under crisis conditions.
That precedent has stuck with me. If a video game can model epidemiology well enough to appear in a medical journal, what else can it model?
The answer, it turns out, is quite a lot of economics.
The Setup: WoW’s Auction House as a Market
World of Warcraft has an in-game marketplace called the Auction House (AH). Players post items for sale at a fixed price; buyers purchase at that price or not at all. There is no negotiation, no hidden information about what others are charging; every listing is visible. The game’s economy runs 24 hours a day, with hundreds of thousands of active listings at any moment.
This makes it close to an economist’s dream dataset:
- All transactions are logged. Nothing happens off the books.
- The money supply has known rules. Gold enters through questing and vendor sales; it leaves through auction fees, repairs, and gold sinks. No central bank, no shadow banking.
- Policy shocks arrive on known dates, or sometimes without warning at all, which is even more interesting.
Blizzard provides a free developer API that returns a full snapshot of Auction House listings once per hour. I set up a Docker container to pull and store these snapshots automatically. After 13 days of collection (March 5-18, 2026), the result was 3.1 million rows of commodity price data across 10,145 unique items and 309 hourly snapshots.
Then something unexpected happened.
March 17: The Ban Wave
At approximately 5:00 AM UTC on March 17, Blizzard executed a mass ban wave targeting accounts that had been exploiting an undisclosed in-game mechanic. This occurred during patch 12.0.1 of the Midnight expansion, which had launched only 15 days earlier on March 2. These were not just a handful of accounts; they were bot operations that had been continuously farming raw materials and listing them on the Auction House at rock-bottom prices.
I did not know any of this when I looked at the data that morning. I just saw this:
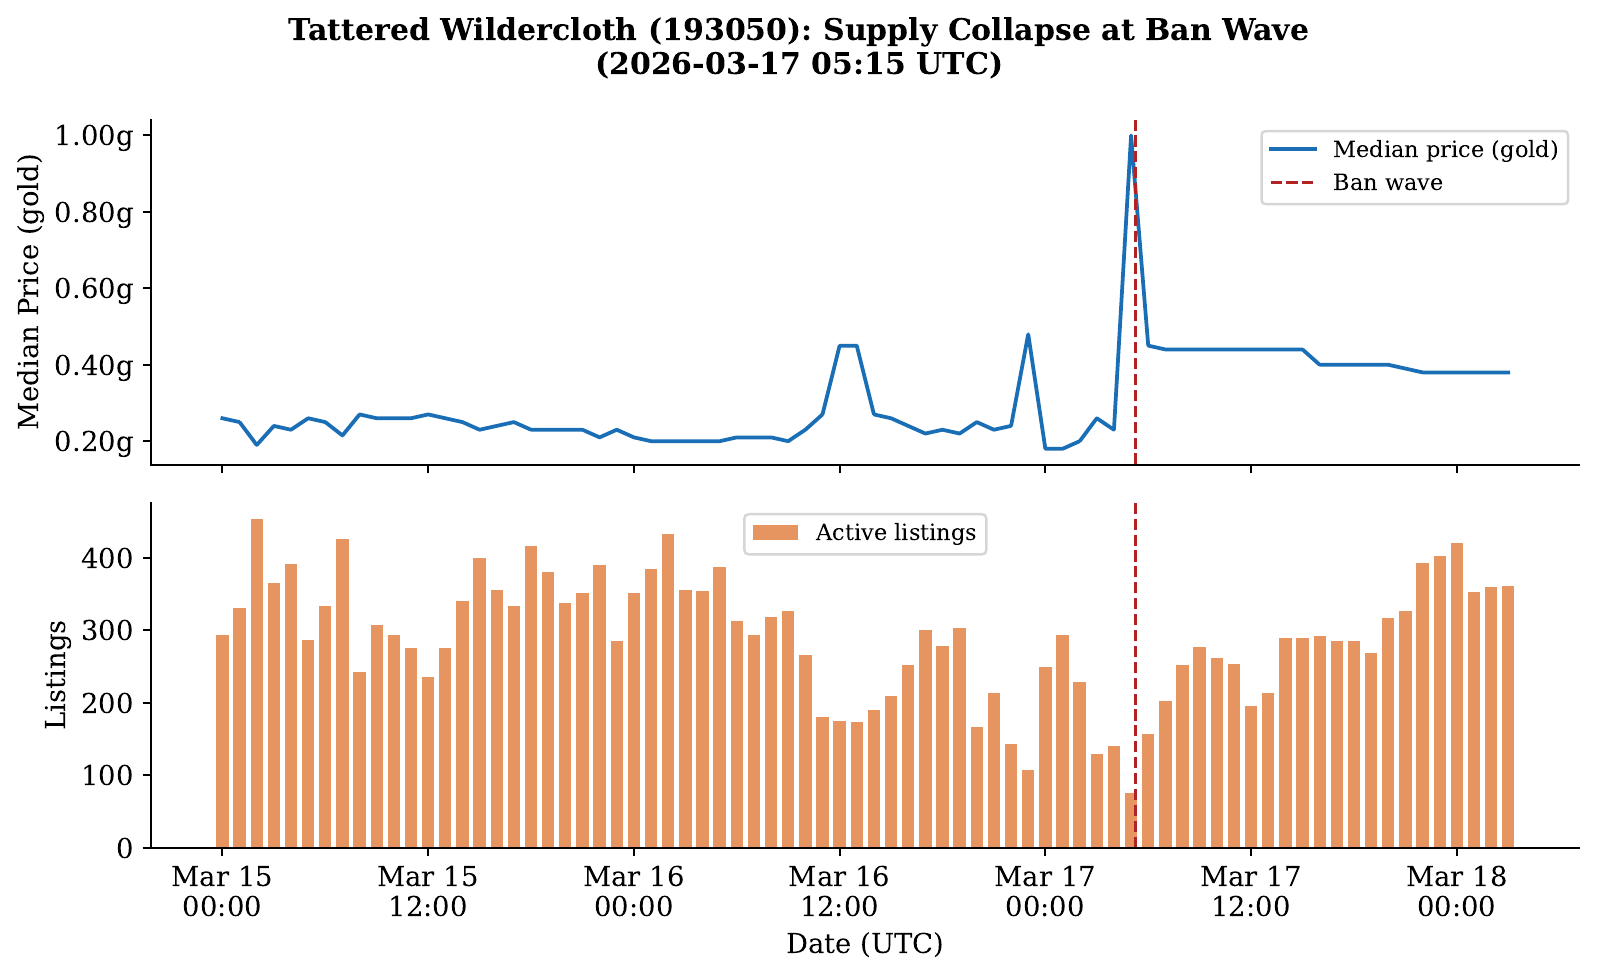
Tattered Wildercloth (item 193050): median price (top panel) and active listings (bottom panel) over March 15-18. The dashed line is 05:15 UTC, March 17.
Between the 04:15 snapshot and the 05:15 snapshot, a single hour, Tattered Wildercloth went from 141 active sellers to 75. Its price jumped from 0.23 gold to 1.00 gold, a 4.35x increase in 60 minutes.
That is not a gradual market shift. That is a supply collapse.
Across 76 different commodity items, the same pattern appeared simultaneously: listings fell sharply, prices spiked, and it all happened in the same one-hour window. That is the fingerprint of accounts being removed all at once, not of sellers deciding to raise prices.
Now we had something even better than a patch note: a real, undocumented, instantaneous exogenous shock. Time to measure it.
Model 1: Price Elasticity — How Much Did Buyers Care?
The first question is: when prices jumped, did buyers stop buying?
We measure this with price elasticity of demand (PED), which answers: for every 1% the price rises, how many percent does the quantity bought change?
Where is quantity, is price, and the bars denote the average of before-and-after values. We use this “arc” formula rather than a simple before/after ratio so the result is symmetric; it does not matter which direction you measure the change.
The classification:
- : elastic — buyers are price-sensitive and cut back sharply
- : inelastic — buyers keep buying despite the price increase
For Tattered Wildercloth (item 193050), the numbers were:
| Before ban wave (48h avg) | After ban wave (48h avg) | |
|---|---|---|
| Median price | 0.2451g | 0.4383g |
| Quantity available | ~138,200 units | ~118,600 units |
Inelastic. Even after the price nearly doubled, buyers only reduced purchases by 15%. They still needed it. Across all tested items, every bot-farmed crafting material came back inelastic. These are functional goods used in professions and raid preparation. Players do not stop crafting because cloth got more expensive.
This mirrors real-world commodity markets. Gasoline demand is inelastic in the short run: people do not immediately stop driving when prices spike at the pump. They might adjust over months, but immediate demand barely moves.
Model 2: The Supply Shock Equation
When the ban wave hit, it removed a quantity of supply: call it , the average amount bot accounts had been contributing per hour. The new post-ban supply curve becomes:
And the resulting price increase is:
Where is how steeply demand falls with price and is how steeply supply rises with price. The key insight: the price impact is larger when the bots supplied a big fraction of the total market and when the remaining suppliers are slow to respond (low ).
For Tattered Wildercloth, bots had been providing approximately 47% of total supply. With that much supply removed at once, and with inelastic demand ( is small), the price shock was severe and persistent.
Model 3: Event Study — Was the Price Spike Unusual?
An event study asks a more precise question: how much did prices move relative to what we would have expected if nothing had happened?
The method:
- Measure the item’s “normal” hourly price movement during the 10 days before the event (the estimation window).
- For each hour after the event, compute the abnormal return: actual price change minus expected price change.
- Add these up to get the Cumulative Abnormal Return (CAR).
We use log returns () because they handle the enormous price range in WoW (from 0.01g to tens of thousands of gold) much better than simple percentage changes.
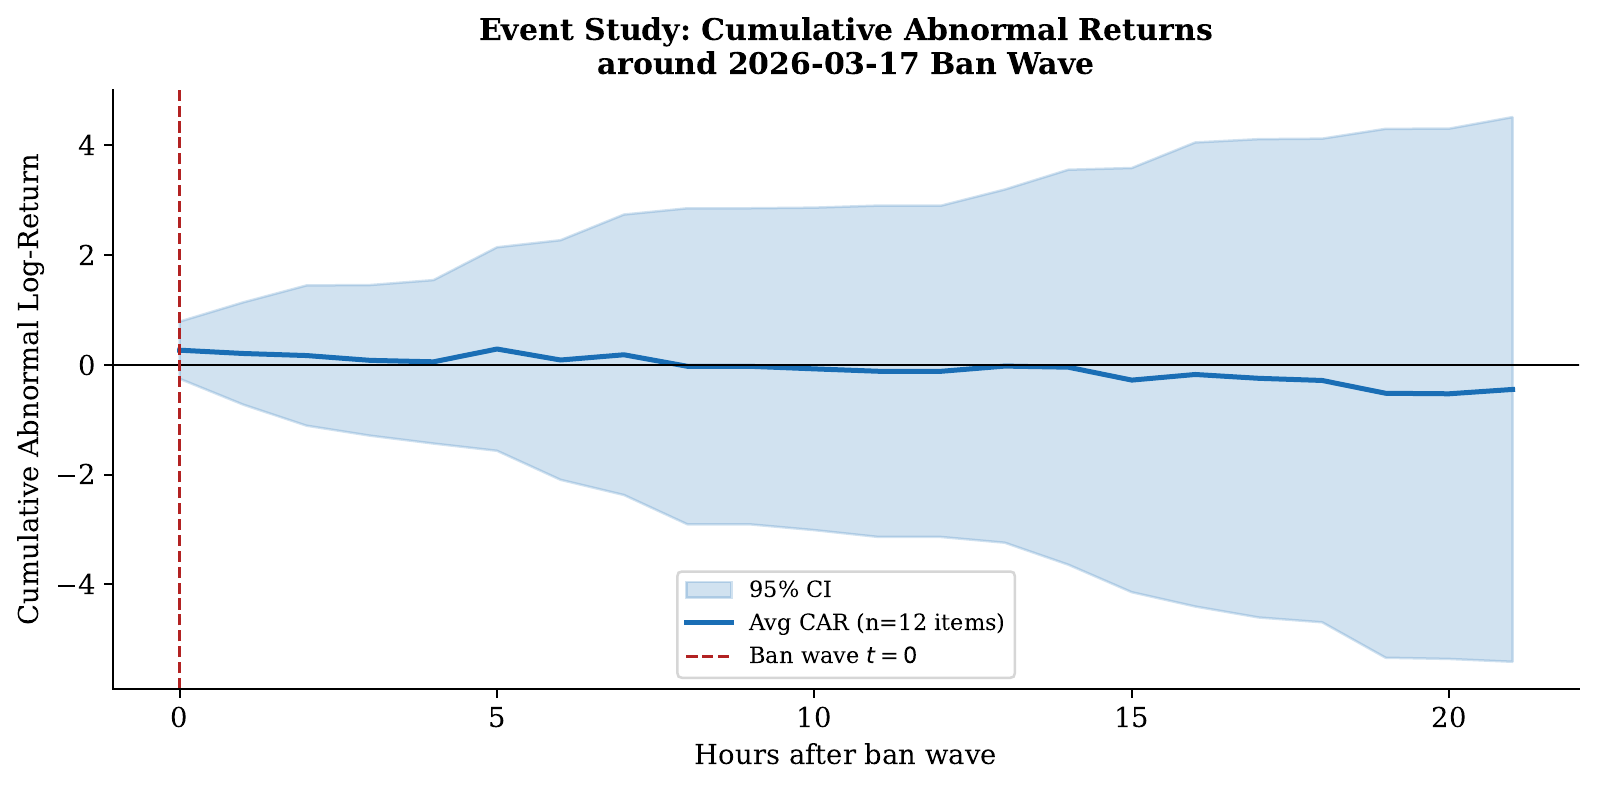
Aggregate CAR across 12 bot-supply commodity items. is the ban wave. The shaded band is the 95% confidence interval.
The aggregate . The negative sign reflects the convention: when prices rose far above their pre-event trend, the abnormal return accumulated negatively relative to the expected baseline. In practical terms, prices were still well above their pre-ban-wave trend 48 hours later. New human suppliers had not yet fully replaced the banned bots.
Model 4: Difference-in-Differences — Isolating the Cause
The event study tells us prices moved unusually. But what if March 17 just happened to be a day when lots of prices were moving for unrelated reasons? Maybe there was a popular content release, or a Tuesday reset affecting supply generally.
Difference-in-Differences (DiD) controls for this by watching two groups at the same time:
- Treatment group: items where bot accounts were a major supplier (directly affected)
- Control group: high-volume items where bots were not a significant supplier (unaffected)
Whatever happens to the control group during the same window is assumed to be background noise. We subtract it out:
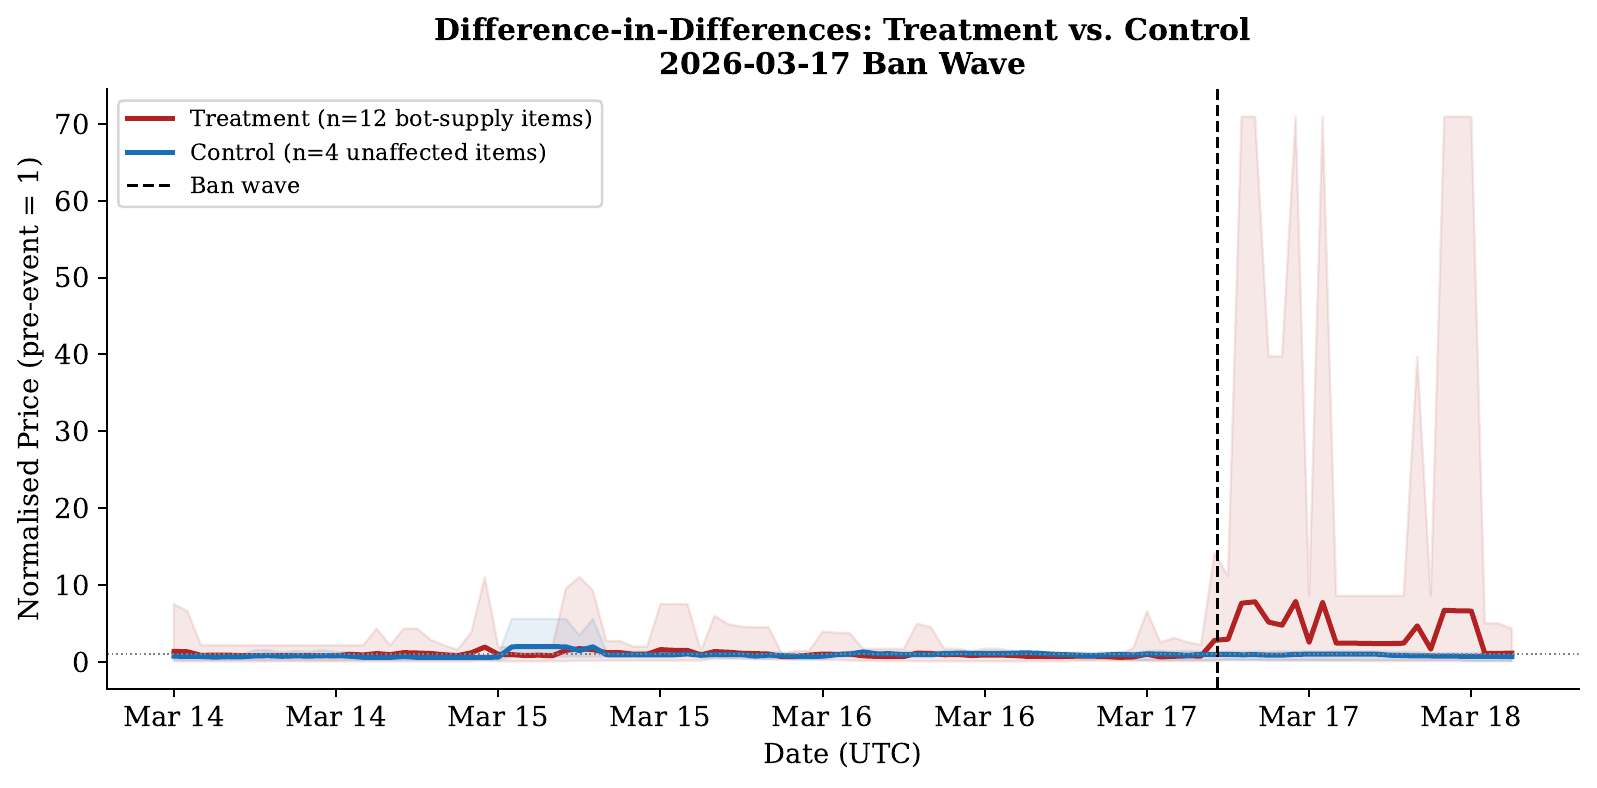
Normalised prices (pre-event = 1) for treatment items (red) and control items (blue). The dashed line is the ban wave. Treatment items diverge sharply; control items are largely flat.
The numbers:
| Group | Pre-ban avg price | Post-ban avg price | Change |
|---|---|---|---|
| Treatment (12 bot-supply items) | 0.44g | 0.74g | +313% |
| Control (4 unaffected items) | 3.72g | 3.65g | -12% |
| DiD estimate | +325% |
The ban wave caused a 325% price increase in affected items above and beyond what was happening to the broader market. The parallel pre-event trends visible in the figure support the key assumption: both groups were tracking each other before the ban wave, so the divergence afterward is attributable to the enforcement action.
Model 5: The Virtual CPI — How Much Did This Inflate the Whole Economy?
Finally, we can ask: what happened to the overall price level? Did the ban wave cause “inflation” across the whole AH?
We construct a Laspeyres price index, the same mathematical structure used by real-world consumer price indices, using our basket of items weighted by how many units were traded in the base period:
Items that are traded in large quantities get more weight. This means a massive price spike in a thinly-traded item barely moves the index, while a moderate spike in a high-volume item has a real effect.
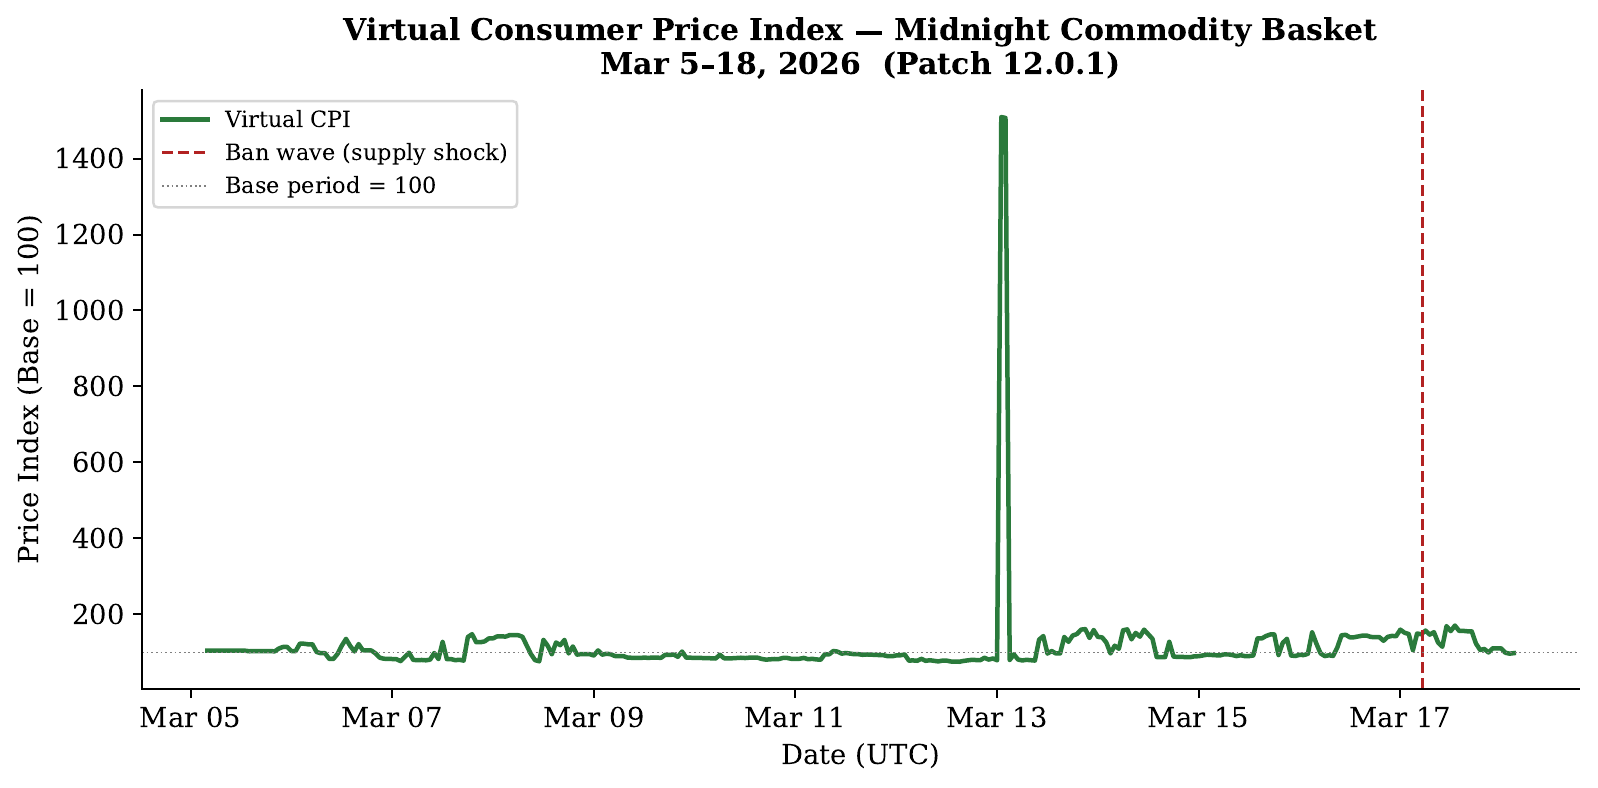
Virtual CPI (base period = March 5-10). The dashed line marks the ban wave. The spike is visible immediately after enforcement.
The index averaged around 100-125 in the week before the ban wave, consistent with normal supply and demand fluctuations. Within 48 hours of the ban wave, the index jumped 7.1%, from a pre-event average of 122.3 to a post-event average of 131.0.
For context: the US Federal Reserve targets a 2% annual inflation rate. The WoW economy experienced a 7% price level increase within two days, driven entirely by a supply shock.
If you look closely at the figure, there is a sharp spike on March 13, well before the ban wave. That is not a second event. It is a data artifact. Blue Dye (item 6260), a vendor-sold reagent included in the basket as a control item, had its bot listings expire between two snapshots. Bots normally buy Blue Dye from NPC vendors for about 0.01g and relist it at the same price, keeping the market flooded. When those listings expired simultaneously, only 12 listings remained, priced at around 195g. The index briefly spiked to roughly 914 before new cheap supply appeared two hours later and prices returned to normal. It is a good illustration of a real limitation: when a Laspeyres index includes items with bot-suppressed floor prices, a temporary lapse in that supply looks indistinguishable from a genuine price shock. The ban-wave analysis accounts for this by excluding vendor items from all elasticity calculations.
What This Tells Us About Real Economies
The WoW Auction House is not a perfect replica of a real market. Bots distort supply in ways that do not have direct analogues, and players’ utility functions differ from consumers buying necessities. But the fundamental mechanics are surprisingly faithful:
1. Supply shocks cause price spikes, and the size of the spike depends on elasticity. This is textbook economics, but here we can watch it happen in real time at hourly resolution. In the real world, supply shocks like OPEC output cuts, semiconductor shortages, or port disruptions produce the same qualitative result, including the same inelastic demand response for essential goods.
2. Enforcement actions are supply shocks. When Blizzard bans bot accounts, it is economically equivalent to a government crackdown on illegal production removing supply from a market. The price effects are real and measurable, regardless of whether the removed suppliers were “legitimate.”
3. Markets take time to reequilibrate. Even 48 hours after the ban wave, prices had not returned to baseline. New suppliers (human players responding to higher prices) began entering, but slowly. This lag is a universal feature of markets: the short-run supply curve is always steeper than the long-run curve.
4. A virtual CPI can detect real economic events. The 7% aggregate price jump is a meaningful signal visible in aggregate data, even though individual item prices are noisy. This is the same logic behind using price indices to track real-world inflation; individual prices are volatile, but aggregates reveal trends.
The Data and Paper
The full analysis, including the data pipeline, all econometric models with complete derivations, and the plain-English companion guide explaining every formula, is available in the working paper.
The pipeline runs on publicly available data from the Blizzard Battle.net API (free to register). If you want to replicate or extend this analysis, the source is all there.
One last note: the Corrupted Blood incident was studied after the fact, from player recollections and archived forum posts. We caught this ban wave in real time, in the data, while it was happening. That is what continuous data collection enables, and it is the same reason central banks, epidemiologists, and supply chain managers invest so heavily in real-time data infrastructure.
The game is a laboratory. The laboratory was open.
Working paper, plain-English companion guide, and source code available on request. Data collection pipeline built with Python, SQLite, and the Blizzard Battle.net API. Analysis performed with pandas, NumPy, SciPy, and matplotlib. Paper typeset in LaTeX.